Reports
Reports capture a snapshot of any dashboard at a specific point in time — so you can review, share, and comment on your data.
A report freezes your dashboard's layout and charts as they appeared when the report was created. You choose a date range, and the report shows data for that period. Unlike dashboards, which always show the latest data, reports preserve a fixed view — useful for quarterly reviews, donor updates, or team discussions.
In this section
- Creating a report — build a new report from a dashboard
- Executive summaries and comments — add context and discuss findings with your team
- Sharing reports — share via public link or email
- Exporting and deleting — download as PDF or remove a report
Viewing your reports
- Select Reports in the left menu. You will see a list of all reports in your organisation.
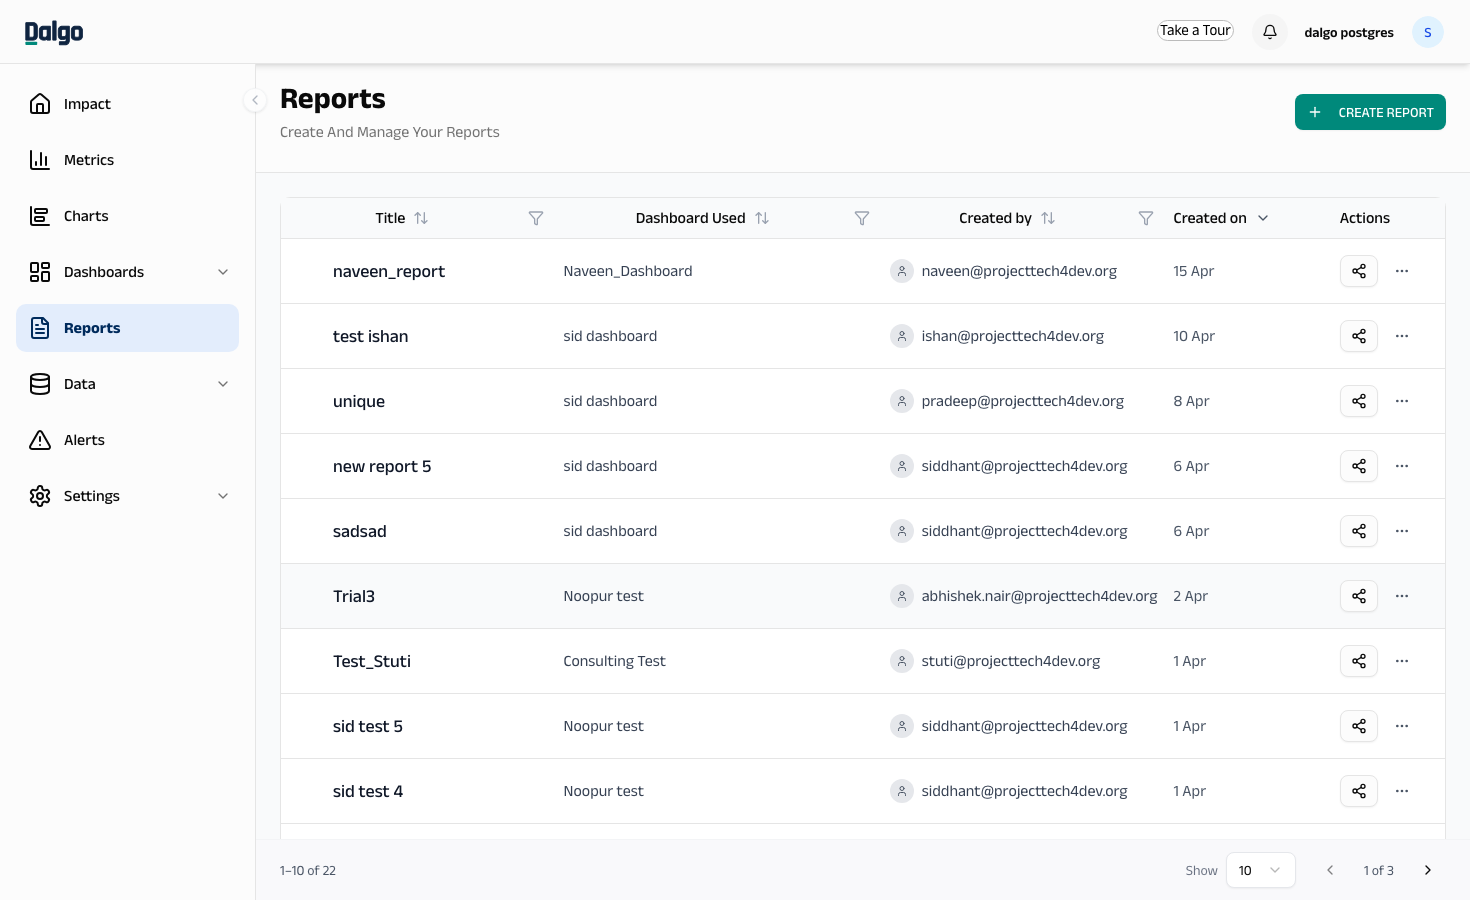
Each report shows its Title, the Dashboard Used to create it, who created it, and when.
- Select the filter icon on any column header to search within that column.
- Select any column header to sort. Select again to reverse.
Related: Dashboards · Charts