Creating your first report
A report captures a dashboard's charts at a specific point in time — useful for quarterly reviews, donor updates, or team meetings.
Steps
- Select Reports in the left menu.
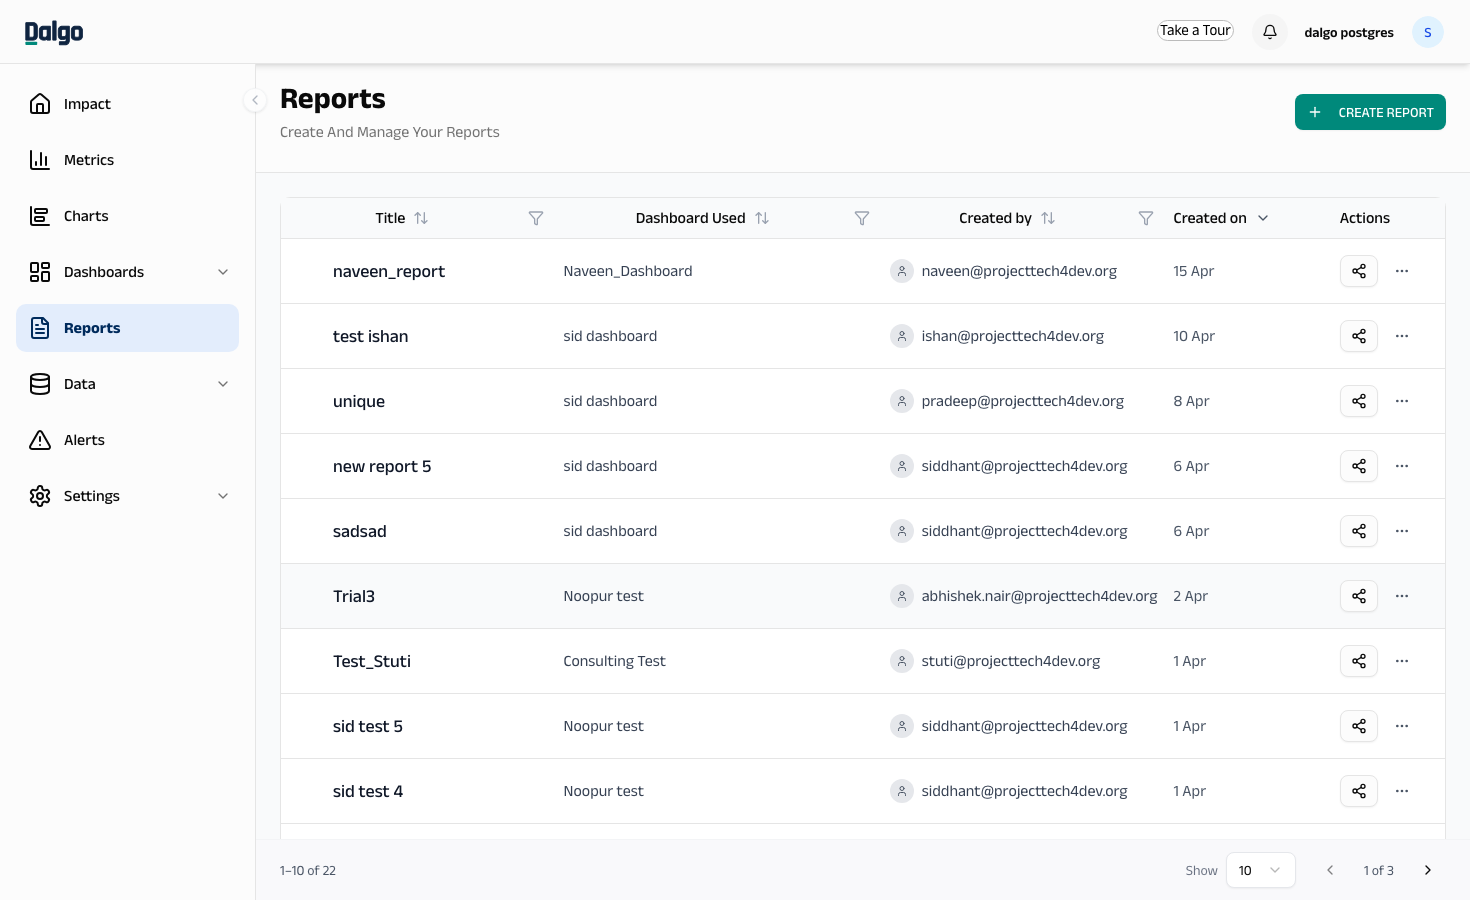 2. Select + CREATE REPORT in the top-right corner.
3. Choose a Dashboard to base the report on.
4. Give the report a Name (e.g. "Q1 2025 Program Update").
5. Select the Date column Dalgo should use to filter data by date.
6. Set the Start date and End date for the period you want to cover.
7. Select Create.
2. Select + CREATE REPORT in the top-right corner.
3. Choose a Dashboard to base the report on.
4. Give the report a Name (e.g. "Q1 2025 Program Update").
5. Select the Date column Dalgo should use to filter data by date.
6. Set the Start date and End date for the period you want to cover.
7. Select Create.
The report is saved and appears in your reports list. Select it to open and view the charts, filtered to your chosen date range.
Sharing the report
Once the report is open, select the share icon (↗) in the top-right corner to share it via a public link or send it as a PDF by email.
→ Next: Where to go next
→ Reference: Reports